


data visualization | interactive maps
Mapbox Services: Data Visualization & Interactive Maps
Explore, understand, and communicate your data in an actionable and visually impactful way with Deep Moiré. The Mapbox services offered here are designed to transform your data into dynamic, custom maps that are both informative and engaging.
As a Developer Freelancer Expert in Mapbox, the goal is to create interactive maps and data visualizations that bring complex information to life in a clear, actionable manner. Whether you need custom mapping solutions or advanced data visualizations, these services ensure your data is easy to interpret and interact with.
Why Choose Mapbox Services?


Unlock your data’s full potential with the Mapbox Services
Transform your data with expert Mapbox services, interactive maps, and custom data visualizations. From concept to execution, our services are tailored to meet your needs.


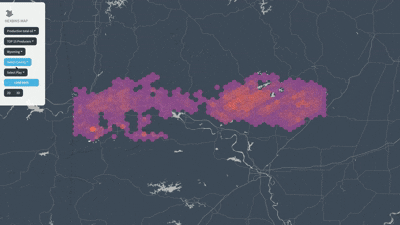
Discover projects that transformed data
Explore a showcase of our successful projects across various industries, from commercial solutions to social impact initiatives. See how we bring your data to life.
trusted by


Process
1
Strategy
In the initial phase, we collaborate to define the project’s goals and expectations.
This involves understanding the availability and structure of the dataset to be visualized.
I also provide examples and references for various visualization approaches, guiding the selection of methods that best align with the project’s objectives.
2
Pre-Production
In this phase, I develop a demo version of the final product.
A smaller subset of the dataset is analyzed and visualized, incorporating preliminary user experience elements.
This version is crucial for establishing data connections and creating the foundational code structure that will serve as the backbone for the full project.
3
Production
In the final phase, the project is fully developed and optimized.
The entire dataset is integrated to ensure scalability and seamless updates as new data becomes available.
All visual and interactive elements—such as styles, fonts, colors, layers, and transitions—are tailored to match the project’s overarching aesthetic and functionality.